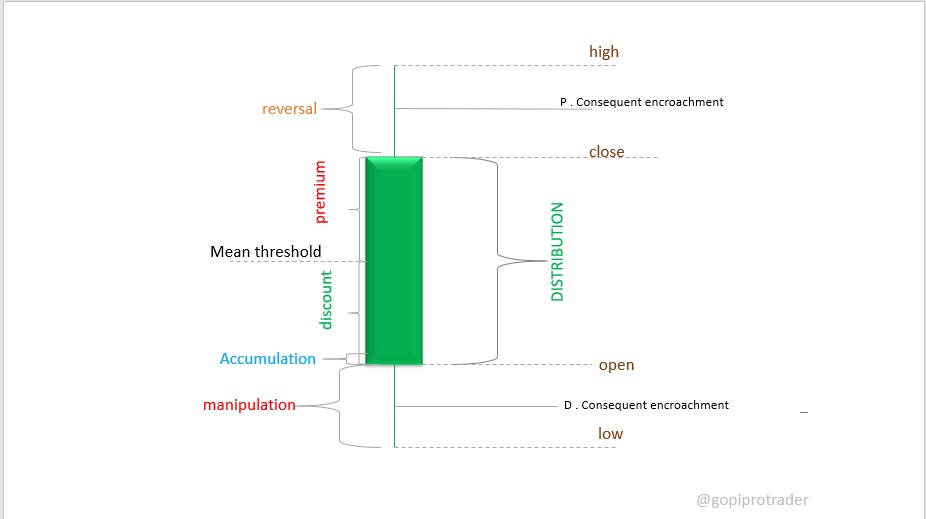
- OPEN: The price at which the candle starts forming, marked near the lower part of the candlestick body.
- HIGH: The highest price reached within the time frame of the candlestick.
- LOW: The lowest price reached within the time frame of the candlestick.
- CLOSE: The price at which the candle ends, marked near the upper part of the candlestick body.
- Manipulation Phase: Occurs before the actual move, where price may take liquidity from retail traders by creating false breakouts or stop hunts.
- Stop Hunt (Liquidity Grab): The price may intentionally move below previous lows or above previous highs to trigger stop losses before reversing.
- Inducement: A setup where price tempts traders to enter early in the wrong direction before the actual move.
- False Breakout: Price briefly moves beyond a key level to trap traders, then reverses sharply.
- Liquidity Sweep: A price move designed to grab liquidity from traders positioned on the wrong side, often occurring before a significant trend shift.
- Spring (Accumulation Manipulation): A sudden dip below support (discount zone) to trigger stop losses before an upward move.
- Upthrust (Distribution Manipulation): A sudden spike above resistance (premium zone) to trigger buy stops before reversing downward.
- Accumulation: Marked in a blue bubble, indicating a liquidity buildup at a discount level where buyers accumulate positions before a potential price expansion.
- Discount Zone: Marked in a green box, where price is considered cheap, and traders may look for buying opportunities, located below the Mean Threshold.
- Premium Zone: Marked in a yellow box, where price is considered expensive, and sellers might take profits or enter short positions, located above the Mean Threshold.
- Mean Threshold: Represented by a dashed line in the middle, acting as an equilibrium point where price shifts between premium and discount zones.
- Reversal: Marked by a yellow line at the top, indicating a possible shift in trend from bullish to bearish.
- Distribution: Labeled in green text next to the body, occurring after price moves to the premium zone, representing selling pressure or profit-taking.
- D. Consequent Encroachment: Dashed line near the low, representing a level where price may revisit to test liquidity before further moves.
- C. Consequent Encroachment: Dashed line near the high, acting as a resistance level where price reacts before reversing.
- Bullish Move: The candlestick represents a bullish move, closing higher than the open.
- Manipulation Before Expansion: The price manipulates liquidity before making a directional move.
- Accumulation at Discount Levels: Price builds liquidity at the discount zone before an upward expansion.
- Premium Zone Distribution: After reaching the premium zone, price undergoes distribution (profit-taking or selling pressure).
- Reversal Signal: The appearance of a reversal at the top suggests potential downside movement.
- Liquidity Reactions: The price is likely to react at key liquidity zones such as consequent encroachments.