The Truth About Fibonacci Trading – A Powerful Tool for Indian Stock Market Traders
Introduction
If you’re an active trader in the Indian stock market, you’ve probably heard about Fibonacci trading. While it’s not a magic formula for instant profits, it’s a powerful tool when used correctly. The Fibonacci sequence, discovered by Italian mathematician Leonardo Fibonacci, helps traders identify key support and resistance levels. Let’s break it down and see how you can apply it to Nifty, Bank Nifty, and stocks like Reliance, Infosys, and TCS.
What is Fibonacci Trading?
Fibonacci numbers follow a sequence where each number is the sum of the two preceding ones:
🔢 1, 2, 3, 5, 8, 13, 21, 34, 55, 89, 144…
From this sequence, traders use Fibonacci ratios derived by dividing numbers in the series:
📌 0.236, 0.382, 0.500, 0.618, 0.764, 1.000, 1.618…
These ratios act as potential turning points in price movements.
- Fibonacci Retracement – Identifying Support Levels
Fibonacci retracement is used to identify areas where the price may pull back before continuing the trend.
🔹 Common retracement levels:
- 23.6% – Weakest support
- 38.2% – Moderate support
- 50% – Strong psychological level
- 61.8% – Golden Ratio, strongest level
- 78.6% – Deep retracement before reversal
🔹 How to use Fibonacci retracement in trading?
- In an uptrend, draw Fibonacci from a Swing Low to Swing High.
- Expect price to retrace to one of the key levels before continuing higher.
- Look for bullish signals (candlestick patterns, RSI, trendline support) to enter trades.
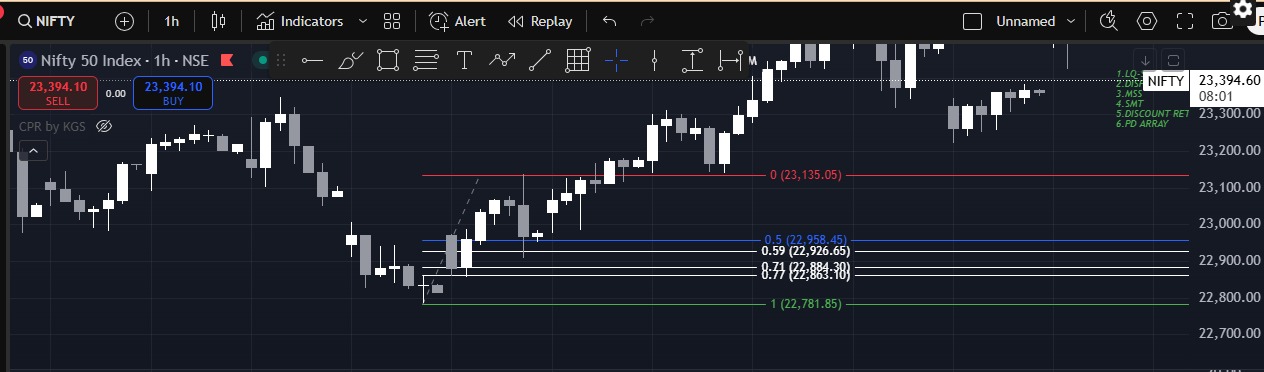
📌 Example (Nifty 50):
If Nifty 50 moves from 18,500 to 19,800, Fibonacci suggests price may retrace to 19,160 (38.2%) or 19,050 (50%) before resuming its uptrend.
🔹 Additional Tip:
To increase accuracy, traders can use Fibonacci retracement levels in combination with volume analysis. If a price retraces to a Fibonacci level with increased volume, it signals stronger support or resistance.
- Fibonacci Extensions – Setting Profit Targets
Fibonacci extensions help predict profit-taking zones where prices may face resistance.
🔹 Common extension levels:
- 100% – Conservative target
- 138.2% – Strong resistance level
- 161.8% – Golden ratio, strong target level
🔹 How to use Fibonacci Extensions?
- In an uptrend, draw Fibonacci from Swing Low → Swing High → Retracement Low.
- The extensions will show where prices may face resistance.
- Use these levels to set profit targets for long trades.
📌 Example (Reliance Industries):
If Reliance moves from ₹2,200 to ₹2,600, retraces to ₹2,400, and resumes the uptrend, Fibonacci suggests possible targets at ₹2,800 (100%), ₹2,900 (138.2%), and ₹3,000 (161.8%).
🔹 Additional Tip:
For better risk management, traders should consider placing stop-loss orders slightly below the retracement level or at a key support level to minimize potential losses.
- Combining Fibonacci with Other Indicators
While Fibonacci levels are powerful, they work best when combined with other technical indicators such as:
📊 Relative Strength Index (RSI) – Helps confirm overbought or oversold conditions.
📊 Moving Averages – Acts as dynamic support and resistance.
📊 MACD (Moving Average Convergence Divergence) – Identifies trend strength and momentum shifts.
Using multiple indicators alongside Fibonacci enhances trade accuracy and reduces false signals.
- Key Takeaways for Indian Market Traders
✅ Fibonacci works best in trending markets (Nifty, Bank Nifty, Stocks like Reliance, TCS, Infosys).
✅ Use Fibonacci retracement to find entry points.
✅ Use Fibonacci extensions to set profit targets.
✅ Combine Fibonacci with price action, RSI, or moving averages for better accuracy.
✅ Never rely on Fibonacci alone – always confirm with other indicators.
✅ Use volume confirmation and stop-loss strategies to enhance risk management.
Would you like a real-time analysis with Fibonacci levels on your favorite stocks? Let me know in the comments! 📊🚀